What is the problem?
A Crash Analysis System (CAS) search 2016-2020 of all crashes in Northland (7388) informs us Travel Speed (driving too fast) was a crash factor in 19.92% of crashes (1472). The same crash factor when applied to all death & serious injury crashes (699) for this same period was a factor in 30.83% percent of those crashes (226).
Between 2016 – 2020 47 people died (40 fatal crashes), 219 were seriously injured (166 serious injury crashes) in crashes where inappropriate speed was a contributing factor.
How does speed affect traffic collisions and injury?
The higher the speed of a vehicle, the shorter the time a driver has to stop and avoid a crash. A car travelling at 50 km/h will typically require 13 metres in which to stop, while a car travelling at 40 km/h will stop in less than 8.5 metres.
An increase in average speed of 1 km/h typically results in a 3% higher risk of a crash involving injury, with a 4–5% increase for crashes that result in fatalities.
Speed also contributes to the severity of the impact when a collision does occur. For car occupants in a crash with an impact speed of 80 km/h, the likelihood of death is 20 times what it would have been at an impact speed of 30 km/h.
Setting and enforcing speed limits are two of the most effective measures in reducing road traffic injuries.
Studies suggest that a 1 km/h decrease in travelling speed would lead to a 2–3% reduction in road crashes.
Statistics sourced via the World Health Organisation (WHO).
What are we doing about it?
There are currently ongoing Speed Management Reviews on both State Highway and Local roads.
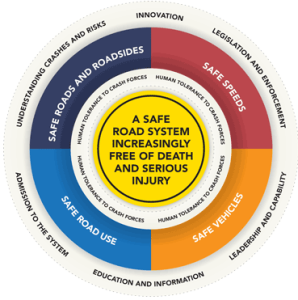
Improving roads and roadsides will encourage people to travel at speeds that are appropriate and safe for the conditions. Improving basic features such as road markings and signage will help road users to identify and understand the speed limit.
The speed that is safe on a road under particular conditions (e.g. wet weather) should be obvious to the road user, but this is often not the case. Many drivers don’t understand that on most journeys their average speed travelled is much lower than posted speed limits. This is influenced by congested roads, road works, weather & road conditions.
Interesting calculations –
The pure math tells us if you travelled –
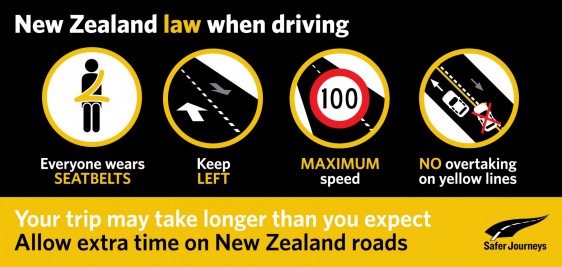
100 kilometres at an uninterrupted 100kms per hour it would take you 1 hour.
100 kilometres at an uninterrupted 95kms per hour it would take you 1 hour 3 minutes 9 seconds – just 3mins & 9secs longer
As we know when considering the above variables the journey time will be a little longer but easing off the accelerator the roads will be safer, you’ll be less fatigued, more refreshed. Always plan your trips & journey times.
In the Road to Zero Action Plan 2020-2022 Focus Area 1 Infrastructure improvements and speed management highlights the key strategic direction by the Government and partners.
Improve road safety in our cities and regions through infrastructure improvements and speed management: Initial actions –
- Invest more in safety treatments and infrastructure improvements
- Review infrastructure standards and guidelines
- Introduce a new approach to tackling unsafe speeds
- Enhance the safety and accessibility of footpaths, bike lanes and cycleways
Remember – The Speed that thrills is usually the speed that Kills.
Check out this ‘physics of speed’ educational game from the Western Australian Governments ‘Road Safety Commission’.


